Beyond the click: using push notification metrics to master performance
 Aleksandra Kozioł
-rlxmrwbt0d.webp) © by SUMALI IBNU CHAMID from Alemedia.id via Canva Pro
© by SUMALI IBNU CHAMID from Alemedia.id via Canva ProPush notifications are a powerful tool for engaging users, driving conversions, and keeping your app or website top-of-mind. But there’s a catch: without tracking the right metrics, you’re essentially sending messages into the void. Some notifications boost engagement — while others annoy users, prompting opt-outs or uninstalls. The difference between the two is data.
In this post, we’ll explore which metrics matter most for web and mobile push notifications and how to use the numbers to continually improve your messaging strategy.
Core push notification metrics to track
Before you can optimize, you need to measure. Here are the most important push notification metrics for your mass, targeted and automated push notifications:
Push notification delivery rate
Push notification delivery rate is the percentage of notifications that actually reach your users’ devices. Low delivery rates may indicate:
technical issues - it's possible that you need to adjust the settings, especially if you introduced changes to your website or mobile app that might have interfered with push campaigns settings.
inactive users - in case of web push notifications, that means that the browser on which the users subscribed is turned off or is not permitted to work in the background (on mobile devices). Smartphone apps can't deliver notifications if the device is turned off.
poor audience targeting. Rethink your audience targeting and keep track of how many users fall into a targeted group, otherwise, your delivery rate will suffer.
Monitoring push notifications delivery rate ensures your push messages - and your effort and time that goes into preparing them - don't go to waste.
Push notification Click-Through Rate (CTR)
Click-through rate - or CTR, or push notification open rate - is the most cited push notification statistic to measure user engagement. These metrics measure engagement. Are users opening your notifications and taking action? Tracking CTR can reveal which messages, headlines, or calls-to-action resonate most. It can also allow you to analyze user behavior in relation to the hours they're active and willing to engage with your content.
Remember that there are non-technical issues that can affect your CTR scores - and sometimes, users see and remember the content of your push notifications and enter the site or app on their own schedule, without opening the push notification properly. Such issues can distort the push notification conversion rate.
Opt-out or unsubscribe rate of push notifications
Push notifications are a privilege, not a right. Tracking opt-outs helps you understand if your messaging is too frequent, irrelevant, or intrusive. This allows you to better adjust to user preferences and likes - especially now that browsers are making it easier to disable push notifications on devices.
If you're concerned you might be sending too many push notifications, consider setting up a capping feature. This option allows you to limit the number of push notifications a subscriber can receive during a day.
Push notification opt-in or subscribe rate
It's not all doom and gloom - users enable notifications when they're fairly sure of the sender. Track when the opt-ins are the highest and test different settings, parameters and widgets to boost push notification subscription rates. In our customers' experience, the best strategy is a one-step push notification subscription form displayed on every page. This way, you can be with your potential subscriber at every step of their user journey, shaping your customer relationships.
Turning push notification metrics into real insights
Metrics are meaningless without interpretation. Here’s how to convert raw data into actionable improvements:
Content analysis
Track CTR and opt-out by message type, tone, and length. Are urgent messages performing better than casual reminders? Do emojis increase engagement, or do they trigger opt-outs? Maybe try and consider if the site's content fulfills the notification's promise?
PushPushGo analytics dashboard allows you to also track push notification metrics like the best-performing lengths of titles and bodies of push notifications. And yes, of course, we have some reading material about the perfect push notification length.

In the end, it's all about sending notifications that your subscribers or app users find interesting.
Timing and frequency optimization
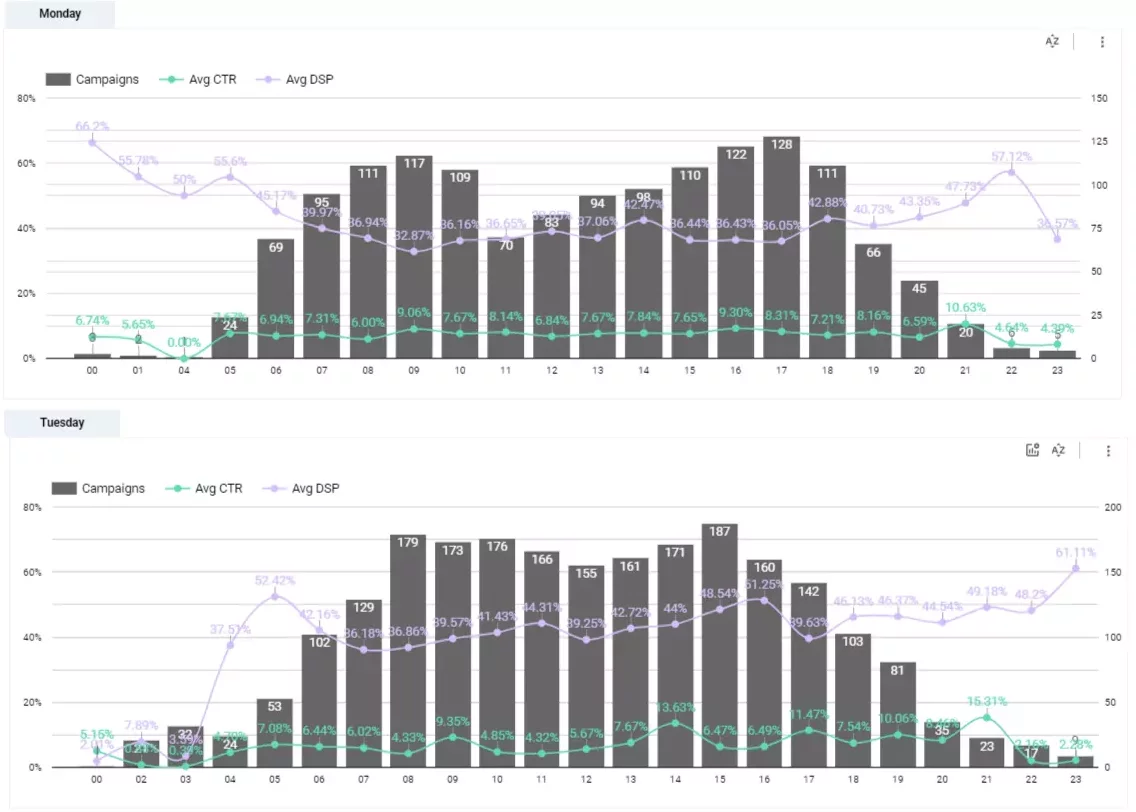
Use time-to-click and CTR data to identify the optimal send windows. If you notice high engagement in the evenings, schedule your push campaigns accordingly. Similarly, monitor opt-outs to avoid notification fatigue.
There's no one-size-fits-all solution or a golden ratio for push notifications. You can use tools at your disposal to track the times when your users are most active - via social media, newsletter open rates, etc., to adjust your push messages for the times of the biggest traffic.
Segmentation
Not all users are equal. Segment by behavior, lifecycle stage, or geography to tailor messaging. New users might respond best to onboarding tips, while loyal users prefer exclusive offers or updates. Personalized messages, targeted push campaigns or automation scenarios deliver higher CTR rates and are a preferred method of communication for many e-commerce customers.
If you're looking for more suggestions concerning effective strategies for using push notifications, we have our clients' case studies to inspire you.
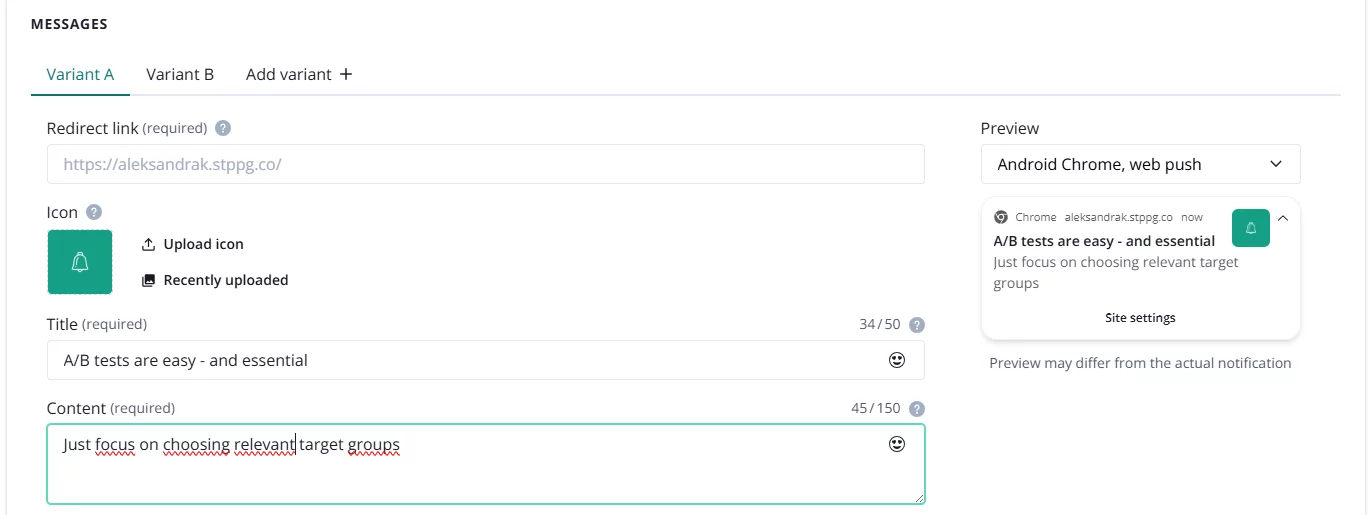
A/B testing
Never assume what works. Test subject lines, notification copy, visuals, and CTA buttons. Metrics from these tests provide evidence for iterative improvements.
A/B testing is a bread and butter of marketing, allowing you to collect insights and grow push campaigns that work. Test one parameter at a time to really learn what clicks with user preferences.
Beware of vanity metrics
Not all push notification metrics tell the full story. It’s easy to get caught up in numbers that look impressive. Let's think of boasting about the data, like total notifications sent or raw impressions, without considering whether they actually drive meaningful results. These are classic vanity metrics: they make your push notification campaigns seem successful on paper but fail to reflect real user behavior. For example, a high delivery rate doesn’t matter if users immediately dismiss the message, and a big subscriber base is useless if engagement keeps dropping and users disable push notifications.
Instead of focusing on volume-based stats, pay closer attention to user engagement patterns — when, how, and why people interact with your notifications. Metrics like click-through rate, conversion rate, and retention lift reveal whether your messages inspire genuine action or just clutter screens. By prioritizing metrics that reflect user intent and long-term engagement, marketers can shift from chasing numbers to building push notification campaigns that truly connect, convert, and sustain attention over time.
Building a feedback loop
A successful push strategy relies on continuous improvement. Here’s how to create a metric-driven feedback loop:
Set up dashboards
You can take full advantage of PushPushGo's analytics dashboard in your panel. Or go one step further and gather all your information in Looker Studio to keep track of every percentage point over a long timespan. Looker Studio allows you to prepare reports and cooperate with other project workers on effective strategies.Regular review
Audit your notifications weekly or monthly - or daily, depending on your push notification strategy. Are CTRs declining? Are opt-outs rising? Use these signals to pivot your push notification strategy.If you're also looking for an industry-wide overview of push notification metrics, download our annual reports.
Iterate and optimize
Adjust messaging based on what the data shows. For example, if lunchtime sends consistently outperform morning notifications, schedule accordingly. If messages with emojis see higher CTRs but also higher opt-outs, refine the tone for balance.Document learnings
Keep track of experiments and results. Over time, your team builds a playbook of strategies that consistently drive engagement.Our playbooks for online publishers and e-commerce businesses provide valuable insights on building a multichannel approach to your brand communication.
Learn from others' ideas
Subscribe to PushPushGo blog or our social media to stay in touch and learn about new developments in our platform. We also share our findings from push notification metrics analyzed in the scope of industries and countries. You can learn from our annual reports and case studies.
Example in action
Imagine you run a fitness app. After reviewing your push notification metrics, you notice:
Notifications sent at 7 a.m. have a 15% CTR.
Notifications sent at 12 p.m. (lunchtime) have a 25% CTR.
Pushes with short, energetic copy outperform long, descriptive messages.
Armed with this push notification data, you can reschedule push notifications to lunchtime, simplify your copy, and segment messages by user activity level. The result? Increased engagement, better retention, and fewer opt-outs.
This, of course, is a purely hypothetical example. We've got some more concrete push notification metrics in our blog post about the best hours and weekdays to send web push notifications.
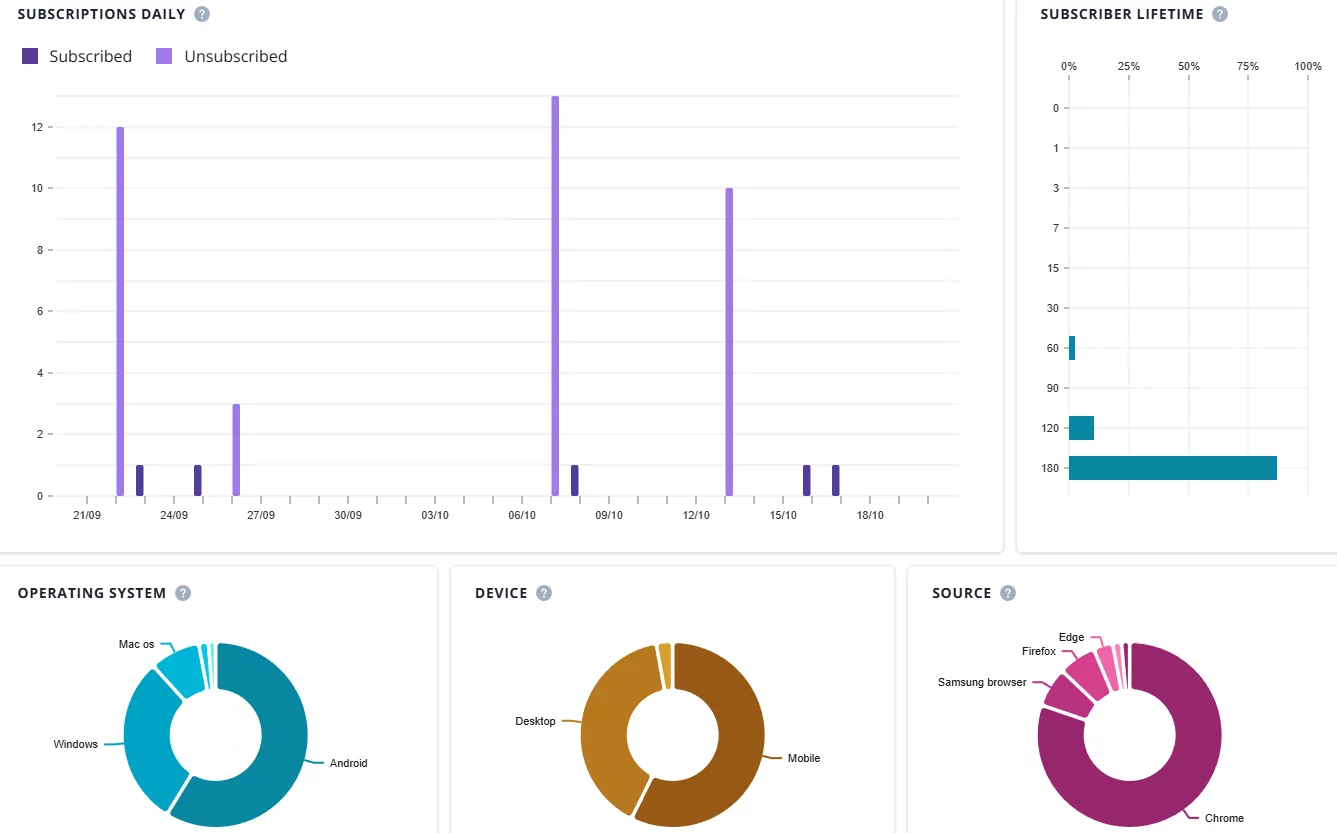
Push notification metrics in PushPushGo dashboard
The analytics dashboard in the PushPushGo application provides you with all the statistics you might need. The current iteration includes the numbers and percentages relating to CTRs, deliveries, open rates, as well as statistics related to subscribers, their actions and specifications regarding devices used (if you notice that your push notifications are opened mainly on Android devices, you may consider formatting them more towards mobile users).
And then there's afore-mentioned Looker Studio. And let's not forget our Customer Support team, helping you achieve the goals you want and advising you on building the best push campaigns to keep your users engaged.
Push notification metrics matter - and so does your message
Push notifications can be a double-edged sword: they either engage users or annoy them. Tracking the key push notification metrics — delivery, CTR, conversion, opt-outs, time-to-click, and retention — allows you to make data-driven decisions that maximize value while respecting your audience. Combined with the data from other sources, like opt-in rates for newsletters, social media engagement and conversion rates, this data will help you shape your overall messaging strategy.
In PushPushGo application, you can track and analyze a wide variety of push notification metrics - from your messages' general performance to details about a specific campaign performance.
Remember: metrics aren’t just numbers — they’re insights into what your users truly want and need. By creating a feedback loop, testing relentlessly, and adjusting based on real-world data, you can turn push notifications from guesswork into a science.
If you're interested in PushPushGo toolkit and its abilities, contact us.
Content Specialist @PushPushGo
Editor and writer. She is interested in media and new technologies.
Try PushPushGo to engage and connect with your audience.
Create an account and start testing!


-luov41vyd0.webp)
