Measuring page performance and Core Web Vitals with an active web push script
 Aleksandra Kozioł
Will the web push script slow down my website and lower my Core Web Vitals scores? This commonly asked question can be answered in a simple "No". But if you want to learn more about Core Web Vitals and other metrics used to measure a website's performance, we've gathered some key information in the article below.
What are Core Web Vitals and why do they matter?
Core Web Vitals were introduced by Google to help developers learn more about their website's performance. The more you know, the more you can improve your scores, bringing a better user experience for your visitors.
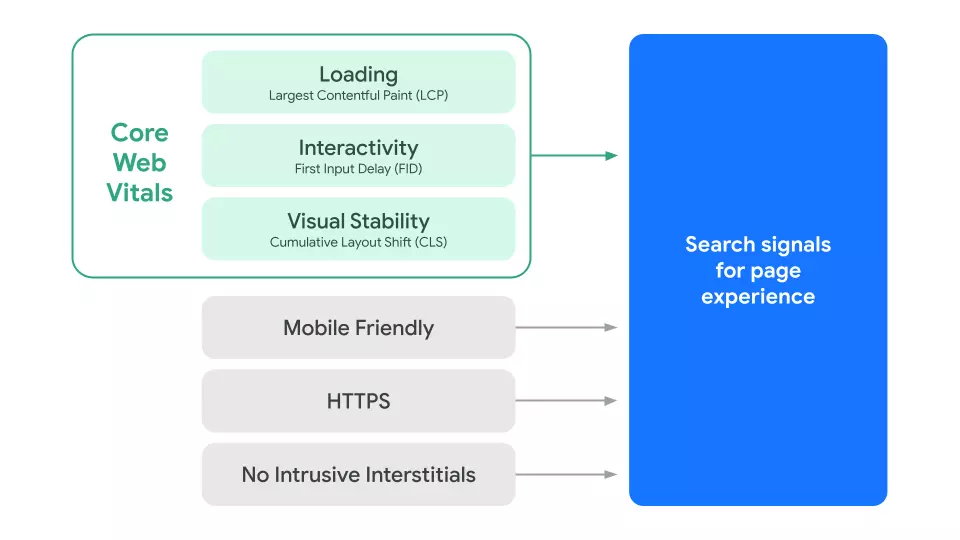
The key factors measured with Core Web Vitals are loading speed, interactivity, and visual stability. As a visitor, you can clearly see when a website takes too long to launch or doesn't allow you to perform certain actions smoothly. This affects your overall experience and lessens the chance of returning to a 'misbehaving' site.
Core Web Vitals are:
Largest Contentful Paint (LCP): measures the loading performance of a website by determining how long it takes for the largest content element on a page to appear on the user's screen. Ideally, LCP should occur within the first 2.5 seconds of the page starting to load.
First Input Delay (FID): measures the interactivity of a website by determining how long it takes for a user's first interaction, such as clicking a button or link, to be processed by the browser. Ideally, FID should be less than 100 milliseconds.
Cumulative Layout Shift (CLS): measures the visual stability of a website by determining the number of unexpected layout shifts that occur during the loading process. Ideally, CLS should be less than 0.1.

Source: developers.google.com
Google launched Core Web Vitals metrics in 2020, adding them as ranking signals to their search algorithm in 2021. At the time of launch, they added that:
"While page experience is important, Google still seeks to rank pages with the best information overall, even if the page experience is subpar. Great page experience doesn’t override having great page content. However, in cases where there are multiple pages with similar content, page experience becomes much more important for visibility in Search."
In May 2023 Google announced that in 2024 FID metric will be replaced by INP - Interaction to Next Paint. This new vital will measure a page’s overall responsiveness to user interactions. This includes the latency of clicks, taps, and keyboard interactions during the visit to the page - not just the delay to the first interaction, as it is with FID.
Measuring page experience
Along with adding new metrics, tools to measure their results popped up.
If you want to test your page results, you can try the following:
Lighthouse runs tests with simulated throttling in a simulated desktop or mobile environment. You can test any page for performance, accessibility, SEO, and best practices.
WebPageTest - allows you to check the performance parameters of a website.
Google PageSpeed Insights checks the website's performance on desktop and mobile devices, adding some additional insights.
Google Search Console provides you with a report on your website's performance along with many other useful metrics.
If you take time to try the tools provided, you may see slight differences in the results or their interpretations. It's worth to cross-examine, getting a better grasp on potential issues.
What affects Core Web Vitals?
Several issues can lower your performance score and make for a longer loading time. Some of the most common aspects are:
Large page sizes. A lot of content, images, videos, and other media can take longer to load.
Slow server response times. If the server hosting the website is slow to respond, it can cause delays in the loading process.
Render-blocking resources. Resources such as CSS and JavaScript files that block the rendering of a page can delay the visual display.
Third-party scripts. Those can include advertising, analytics, and web push scripts which can delay the loading process.
Unoptimized images. Large or unoptimized images can take longer to load, so websites now switch from JPG or PNG formats to much lighter WEBP.
Poorly written or inefficient code.
Web push and website speed
Web push can have an effect on First Input Delay metrics. In the case of the two-step subscription form, the Cumulative Layout Shift is also slightly affected.
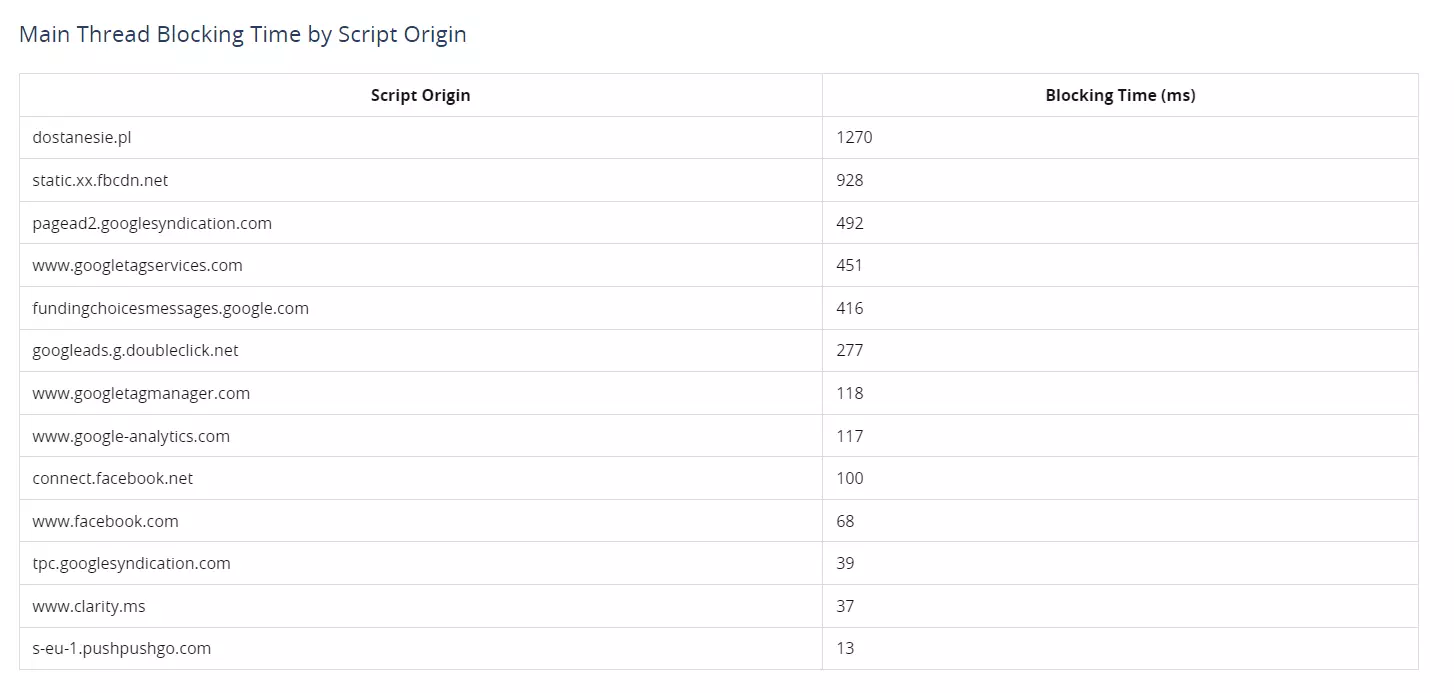
The PushPushGo web push script doesn't slow down websites in a significant way. Especially if we compare it to other commonly used scripts, you can see that the result of the 13 ms delay is almost infinitesimal. The page speed test we conducted on one of the websites using web push brought the following results:

Source: dostanesie.pl results in WebPage Test
Thread Blocking Time is another metric displaying the website's performance. It calculates the time between the first content element appearing on the user's screen and a page becoming fully interactive.
Final thoughts
Now that you know the basics of performance tracking and the most important factors that can affect them, you'll be better equipped to optimize your website's speed and user experience. Don't forget that although Core Web Vitals are important, Google algorithms (and, frankly, your users) are looking for valuable content in the first place.
If you want to learn more about PushPushGo and talk about the script and web push tools, drop us a line at [email protected]

Content Specialist @PushPushGo
Editor and writer. She is interested in media and new technologies.
Try PushPushGo to engage and connect with your audience.
Create an account and start testing!


-3d8jqxhvln.webp)
